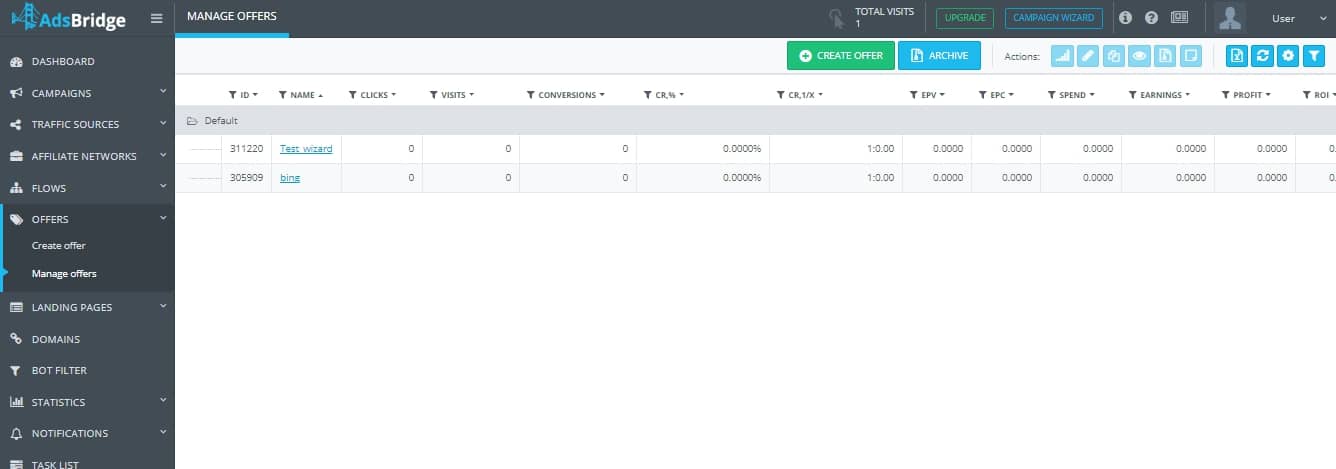
Within this tab, you will be able to see all of your created Offers. You can also return to the “create offer” page by clicking “Create offer”. You can see all of your archived offers upon clicking the “Archive” button.
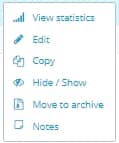
In the upper right-hand corner, you will see a panel labeled “Actions”.
![]()
The “View Statistics” icon will be activated upon the selection of a particular offer. By clicking this icon, you will be taken to the statistics tab for the selected offer, where more information will be available.

The “Edit” icon will also become active once an offer has been selected, and will allow you to edit the selected offer once clicked.

The “Copy” icon will also become active once an offer has been selected. Clicking this icon will allow you to copy the offer, as well as its settings. The name of the copied offer will be the same, but with “copy 1” added to it.

The “Hide/Show” icon becomes active when you select a particular offer. This option allows you to hide the offer from the list, if necessary, or return the offer to the list. In order to display the hidden offer in the manage offers tab, you need to check the “Visible” checkbox in the ‘filters’ sidebar of this section.

The “Move to archive” icon will also become active once an offer has been selected. There is currently no way to delete an offer from the AdsBridge platform. If you do not wish to continue using a particular offer, you may place it in our archive. If you decided later on that you would like to revive the archived offer, you may do so. You may search for offers within the archive itself by name and ID. Information available about offers located in the archive: ID, name, date of placement into archive, actions (the icon for to statistics about the selected offer).
The “Export” icon is used for exporting statistics already being displayed on the page into CSV.
The “Update” icon must be clicked to update statistics, as AdsBridge does not update statistics upon page refresh.
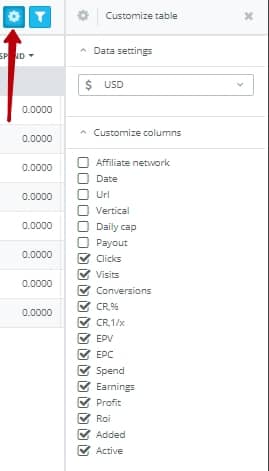
The “Change Table” icon – opens a side menu where you can edit the display of statistics in the offer management section of the account. At the moment, the following columns are available: Affiliate network, Date (Create Offer), URL, Vertical, Daily cap (displays offers with this option in the form of the number of conversions as a limit), Payout (value of payout for one conversion), Clicks, Visits , Conversions, EPV, EPC, Expense, Revenue, Profit, ROI, Added (this column shows the number of campaigns to which a certain offer was added), Active (this column shows the number of campaigns in which a particular offer is active).
In order to view detailed information about which campaigns are added to and which campaigns the offer is active in, you need to click on the number of campaigns listed in the “Added” or “Active” column. After that pop-up will open, in which you will see the campaign ID, Campaign name, Number of times (how many times the offer was added to the campaign), Action (transfer to the statistics of this campaign). Also, when you click on the arrow next to the value of the campaign ID, you will see the paths to which the offer is added within the specified campaign (path ID, path name and the ability to go to the statistics section of the campaign for this path).
In addition, you can choose the currency in the table settings in which you will see the expense, income, and profit. The payout column will display a static value indicating the currency in the column itself.
The “Filter” icon opens a side window in which you are able to edit the way statistics are displayed in the manage offers tab.
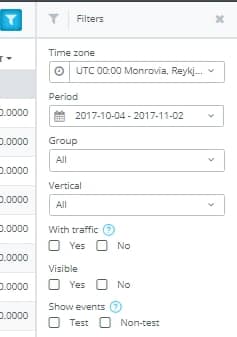
This menu has the following options:
“Time Zone” – you will need to choose the time zone you in which your statistics will be displayed. We suggest choosing the time zone that corresponds with the selected offer so the statistics will be as actual as possible.
“Period” – here, you can choose the time period you would like to see displayed in the statistics in the managing offers tab. By default, the periods; today, yesterday, this week, last 7 days, last week, this month, last 30 days, and last month, are available. Please remember that upon choosing option such as ‘last 7 days’ and ‘last 30 days’, the statistics will not include today’s date. The ‘last week’ and ‘last month’ option will display statistics for the last full week/month. For the ‘this week’ and ‘this month’ options, the statistics will display information from the beginning of this week/month including today.
“Group” – in the drop-down list of this option, you can select a group of offers for which you would like to see statistics.
“Vertical” – in the drop-down list of this option you can select the vertical of the offers, on which you would like to see the statistics.
“With traffic” – if you choose ‘yes’, then all of the offers which have received one click or more for the selected period will be displayed. If you choose ‘no’, then the offers which have received no traffic for the selected period will be displayed. You may view statistics for offers with and without traffic simultaneously by marking both checkboxes.
“Visible” – if you select the “Yes” option, only those offers that are not hidden will displayed in the table. If you select the “No” option, only those offers that are hidden by the “Show / Hide” option are displayed in the table (you can view the statistics at the same time on hidden and not hidden offers when selecting both checkboxes).
“Show events” – by selecting ‘test’, the statistics will display only test events (events that occurred through your test campaign link). You may look at both test and non-test simultaneously by marking both checkboxes.
In the “Total” row at the bottom of your statistics, you will see a sum of values, divided into sections.
Please be aware that you are able to filter by specific values in a couple columns. To do so, you need to click the filter button near the name of the column, and then press “Apply”. If there are too many values within a column, the system will not load the list automatically. Nevertheless, you can find needed values by entering in the value and pressing “Enter”. After this, a checkbox will appear with the value, and you will need to select it, and press “Apply”.

In the visits, clicks, conversions, EPV, EPC, spend, earnings, profit, and ROI, you can filter by the following; equal to, greater/lesser than, less/greater or equal to, or not equal to.
Upon click the arrow to the right of the name of the column, there is an option to filter by alphabetical order (A-Z, Z-A, A-Я, Я-А) or by amount (from least to greatest and vice versa).
Upon right clicking the row of a specific offer, you will be presented with a menu with the following options: view statistics, edit, copy, move to archive.
By double clicking on the row of a specific offer, another window in your browser will open with the statistics of that offer.