The Dashboard is the very first section in the left sidebar of the AdsBridge admin panel. Here are displayed the Top 5 of Campaigns, Traffic Sources, Offers, Landing pages, Countries, and Traffic Types.
The Dashboard enables you to choose the time zone, date, currency (USD, EUR, GBP, RUB, UAH) and the value/event you would like to view statistics on (visits, clicks, conversions, spend, earnings, profit, ROI).
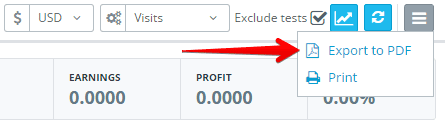
To browse statistics only on live traffic that has gone through Campaign URLs, and exclude statistics for conversions made through the Campaign test URL, please tick “Exclude tests”.
“Chart” icon opens the graph of statistics.
“Refresh” icon is used to update the statistics.
The data you see on the Dashboard can be exported to CSV or printed.
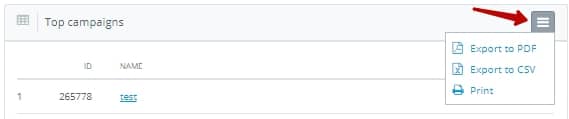
Additionally, you can print and download as a CSV/PDF file one of the blocks displayed on the Dashboard.
The block located under the settings for displaying stats on the Dashboard contains the essential information on the visits, clicks, conversions, spend, earnings, ROI for your campaigns, not just the top 5.
You can notice the pie charts in the “Top country” and “Top traffic types” blocks.
Please note: the time zone and period on the Dashboard are not synchronized with the time zone and period in the AdsBridge stats.