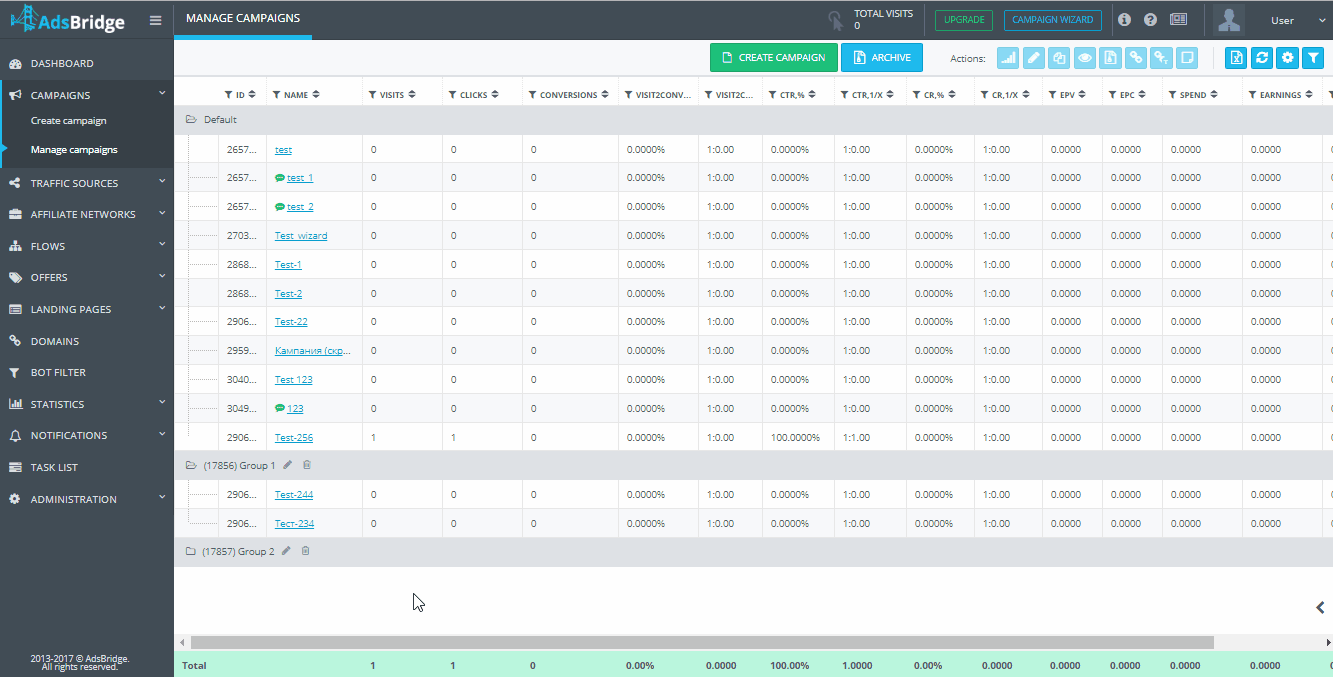
This page displays all the previously created campaigns. Also, from here you can go to the page of campaign creation by clicking the “Create campaign” button. In order to view the archived campaigns, click on the “Archive” button.
Campaigns are distributed into groups that are specified in the campaign settings. You can hide the Group (folder) by clicking upon the folder icon.
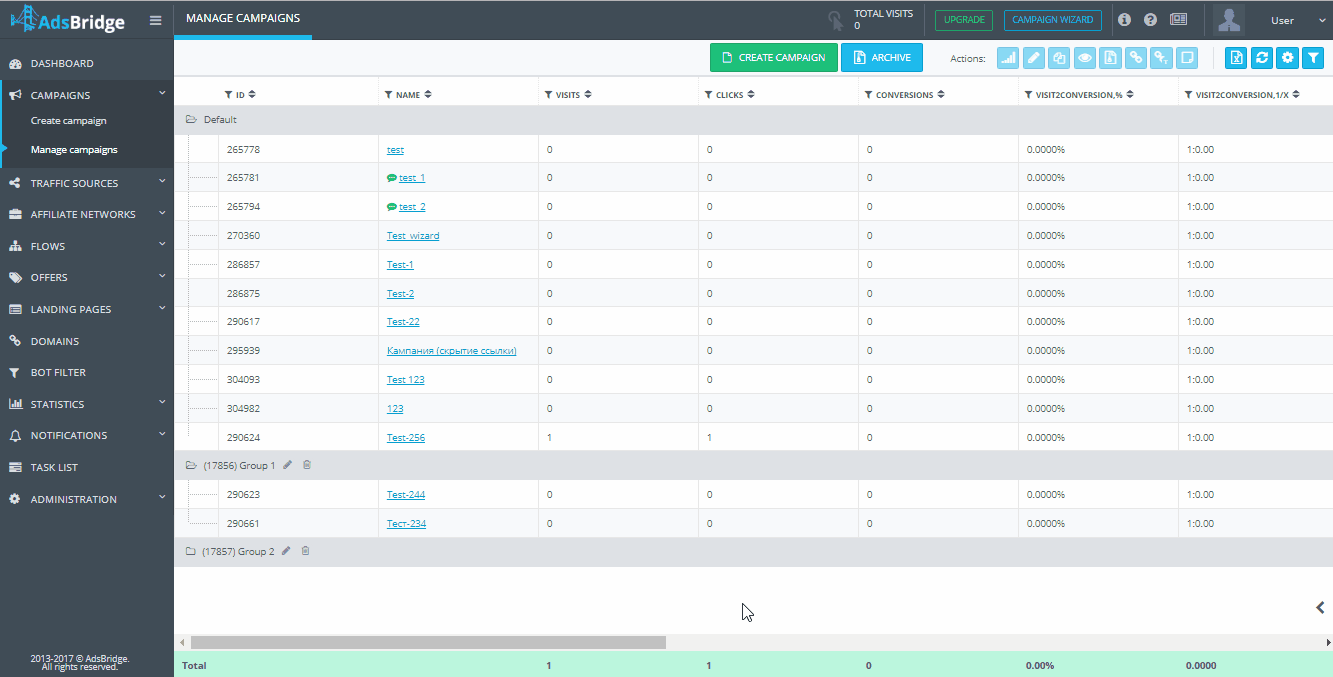
There is the Actions panel in the upper right corner of the page.
![]()
“View statistics” – becomes active when selecting a specific campaign on the page. By clicking upon this icon, you will be sent to the Statistics section of this campaign, which contains more information.

“Edit” – becomes active when you select a particular campaign. This feature allows you to go to the edit page of this campaign.
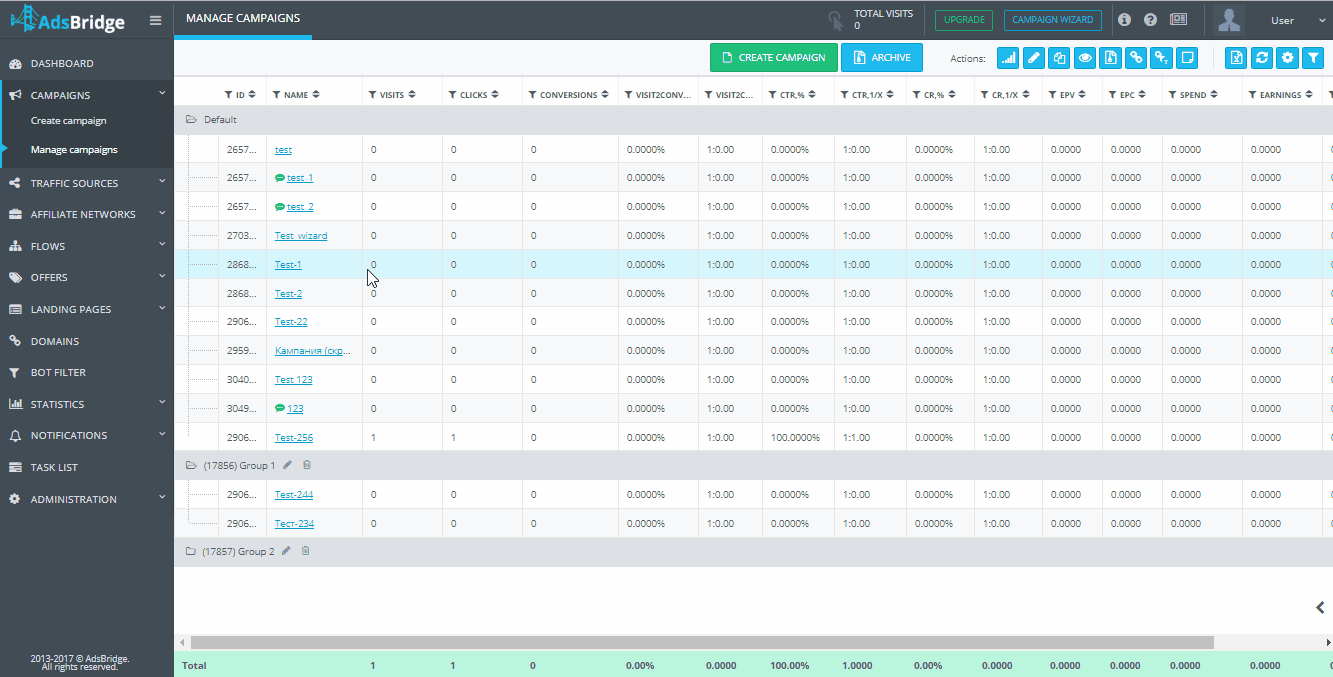
“Copy” – becomes active when you select a particular campaign. This feature allows you copy the campaign and its settings. The name of this campaign will be similar to the name of the copied campaign (+ _copy1).

“Update total costs” – when you click this button, you will see a pop-up window where you are supposed to enter the following: time zone, update period (the maximum period is 31 days, besides, you cannot update costs for today), costs value (currency will correspond to the one that was chosen when creating the campaigns), and the cost model (CPV, total CPV, CPA, total CPA). The total CPV takes the entered value and divides it by the total number of visits for the selected campaign for a specific period. For example, if the total CPV equals 50, the total number of visits equals 1000, the calculated CPV will be 50/1000 = 0.05. The total CPA works the same way except for one particularity – it divides the value by the total number of conversions.
“Update costs by token” – when you click upon this button, you will be shown a pop-up in which you must specify the following: time zone, period for updating costs (the maximum period is 31 days; besides, you cannot update costs for today), Token, Token ID, costs value (the currency will match the one that was selected when creating the campaigns), and the cost model. The total CPV takes the entered value and divides it by the total number of visits for the selected campaign for a specific period. For example, if the total CPV equals 50, the total number of visits equals 1000, the calculated CPV will be 50/1000 = 0.05. The total CPA works the same way except for one particularity – it divides the value by the total number of conversions.
“Hide / Show” – becomes active when you select a specific campaign. This option allows you to hide the campaign from the list if necessary or to return it to the list. In order to output a hidden campaign in the campaign management section, you need to check the “Visibility” checkbox in the sidebar of this section.
“Move to archive” – becomes active when you select a specific campaign. At the moment, you cannot delete a campaign from the AdsBridge system, so if you no longer want to use the campaign, you can move it to the archive. Archived campaigns can be returned to the active campaigns section. You can search campaigns by their IDs and names within the Archive itself.
Here’s the information available about the archived campaigns: ID, Name, URL, Archiving date, Actions (is represented as a transition icon to the statistics section of the given campaign). Bear in mind that traffic can keep coming through to the archived campaign, and it will be counted in the pricing plan.
“Get link” – becomes active when you select a specific campaign. This option opens a pop-up, where you will see a Campaign URL ready for copying. Press Ctrl + C (Cmd + C for Mac) to copy the link to the clipboard. To close the pop-up, click “Ok”.
“Get test link” – becomes active when you select a specific campaign. This option opens a pop-up, where you will see a Campaign URL ready for copying. Press Ctrl + C (Cmd + C for Mac) to copy the link to the clipboard. To close the pop-up, click “Ok”. A test link is used to check the campaign and display its statistics, but in a way such test statistics has no impact on the live traffic report.
“Notes” – becomes active when you select a specific campaign. If necessary, you can leave any note about the campaign here. To do so, just enter the text in the bottom field. You can make use of the following text editing options: cancel the action, repeat the action, write in bold, write in italics, underline the text, cross the text out. After you entered the text, click “Apply”, and it will be displayed in the top field. You will know a note is added successfully when a corresponding icon appears next to the Flow name.
Information that is available about the note: the name of the manager who left the note (this information may be needed in case of using the function of multi-user access to the account) and the date.
Aside from that, you can edit and/or delete the note.
Please note that when copying a campaign, the note is not copied.
“Export” – this feature allows you to export the information about your campaigns in the CSV format.
“Refresh” is used to update the stats displayed on the screen.
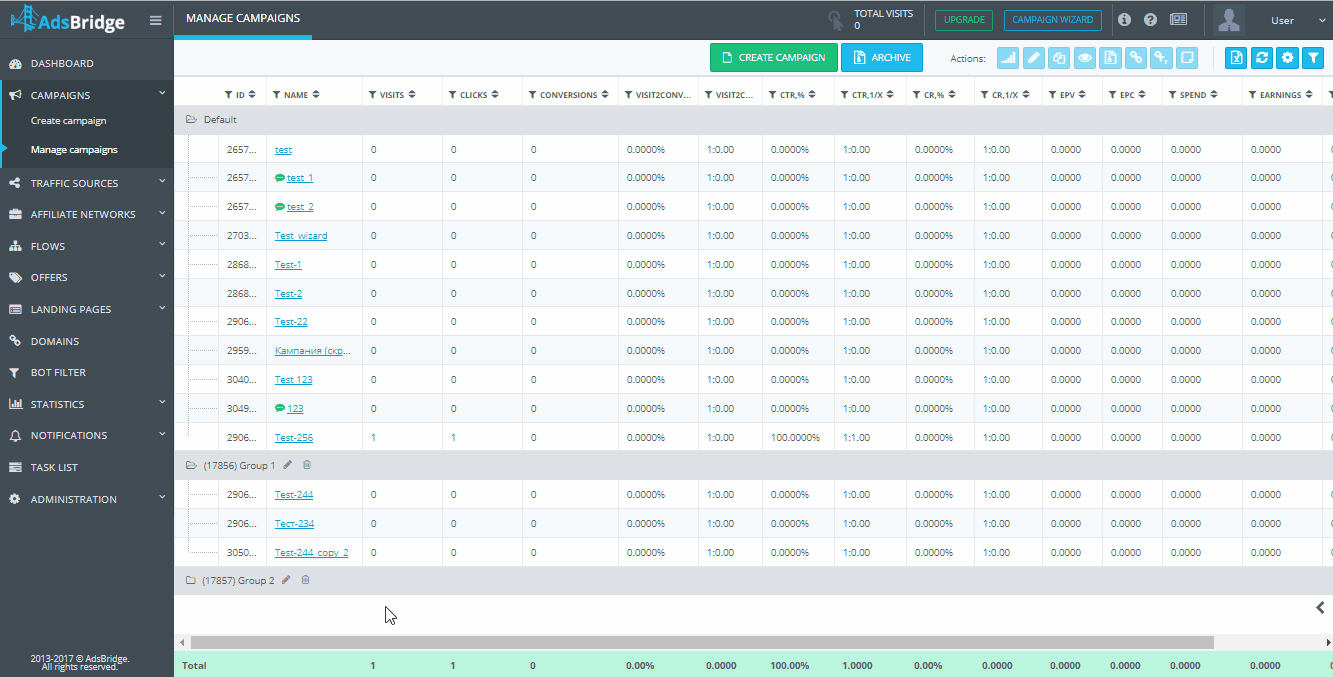
“Customize table” – opens the sidebar where you can edit the displaying of statistics in the campaign management section. Currently, there available columns are as follows: Traffic source, URL, Date (campaign creation date), Cost model, Cost value, Hide referrer, Impressions, Visits, Clicks, Conversions, Visit2Conversion,%, Visit2Conversion, 1/x, CTR,%, CTR, 1/x, CR,%, CR, 1/x, EPV, EPC, Spend, Earnings, Profit, ROI, VLH (the number of visits for the last full hour), CLH (the number of clicks for the last full hour), CvLH (the number of conversions for the last full hour), ELH (profit for the last full hour), LCT (time of the last conversion for the selected period, for example: 2017-07-17 22:00:00), Auto optimization, Bot filter, Rules, Paths, Landing pages, Offers.
In the table settings, you can also select the currency to display EPV, EPC, spend, earnings, and profit.

“Filters” icon opens the side menu in which you can set the statistics’ display in the “Manage campaigns” section.
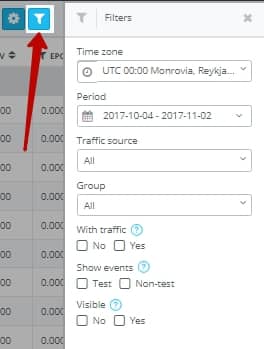
This menu contains the following options:
“Time zone” – you can select the time zone in which you’d like to view the statistics.
“Period” – set the period within which you’d like to view statistics in the “Manage campaigns” section. By default, there are such options: Today, Yesterday, This week, Last 7 days, Last week, This month, Last 30 days, Last month.
Please note that when choosing such options as “Last 7 days” and “Last 30 days”, the displayed statistics won’t include today. “Last week” and “Last month” display statistics for the last week/month. “This week” and “This month” displays statistics for the period from the beginning of the week/month to the present day.
“Traffic source” is meant to group statistics on a chosen traffic source. Please note that this option will work only if you created a traffic source and added it to the campaign at the first step.
“Group” – in the drop-down for this option, you can choose the group of campaigns for which you’d like to view the statistics.
“With traffic” – if you choose “Yes”, the table will display all campaigns that have at least one visit by the specified period. If you mark “No”, then the table will display the campaigns that didn’t receive any visits for the specified period. You can view statistics with or without traffic at the same time by ticking both boxes or clearing the ticks.
“View events” – by selecting “Test”, the table will display only the test events (events, which were made by the test campaign link), “Non-test” – only non-test events. You can view statistics by test and non-test events at the same time if you tick both boxes or clear the ticks.
“View events” – by selecting “Test”, the table will display only the test events (events, which were made by the test campaign link), “Non-test” – only non-test events. You can view statistics by test and non-test events at the same time if you tick both boxes or clear the ticks.
“Visible” – if you choose “Yes”, the table will display only those campaigns that were not hidden. If you mark “No”, the table will display only those campaigns that were hidden with the help of “Show / Hide” option. You can view statistics on hidden and visible campaigns at the same time by ticking both boxes or clearing the ticks.
In the “Total” line of this section, you will see the total value for some parameters.
Please note that you can filter data by specific values in some columns. For this, you need to press the “Filter” icon near the column name, select the value and press “Apply”.

If there are too many values in the column, the system won’t upload the list automatically; however, you can still find the needed value by entering its name and pressing “Enter”. After that, the checkbox with this value will be displayed, tick it and click on the “Apply” button. In the columns Impressions, Visits, Clicks, Conversions, Visit2Conversion,%, CTR,%, CR,%, EPV, EPC, Spend, Earnings, Profit, ROI, VLH, CLH, CvLH, ELH, you can filter data using the following conditions: equal, more, less, more or equal, less or equal, not equal.
By clicking on the arrow icon near the column name, you can sort it alphabetically (A-Z, Z-A) or by quantity (from larger to smaller and vice versa).
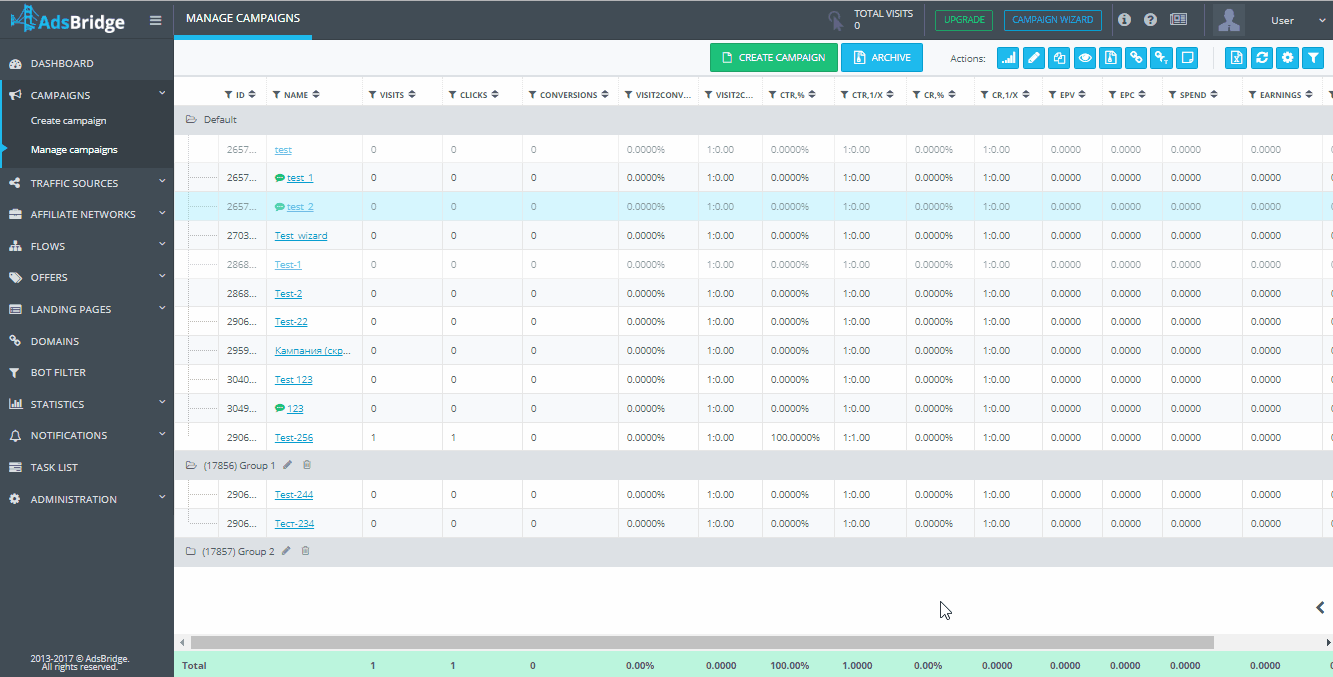
Also, if to right-click on the line with a specific campaign, you will see the menu with a list of actions: View statistics, Edit, Copy, Update total costs, Update costs by token, Show / Hide, Move to archive, Get link, Get test link, Notes.
A double-click on a line with a specific campaign opens the additional browser window with statistics on this campaign.