Statistics is the tracker’s main section that enables you to view the detailed information on your campaigns. This section includes three subsections: Global report, Conversion report, Edit conversions, and Manage custom reports.
“Global report” subsection contains 7 tabs: Total, Flows, Campaigns, Traffic sources, Affiliate networks, Offers, Landing pages.
The “Total” tab lets you view the stats on all your campaigns at once. The “Flows” tab displays the data on any given flow or the entirety thereof. “Campaigns” – this tab shows the stats on all campaigns, group of campaigns, or any given campaign. The “Traffic sources” tab contains data on any traffic source or the entirety thereof. “Affiliate networks” tab contains data on any affiliate network or the entirety thereof. “Offers” tab contains data on any offer or the entirety thereof. In the “Landing pages” tab you can see the stats on your landing pages.
Please keep in mind that the statistics on affiliate networks and traffic sources will be available in case you have pre-selected the traffic source in the campaign settings on the first step of its creation, whereas the affiliate network is selected in the offer settings that had been added to any of your campaigns.
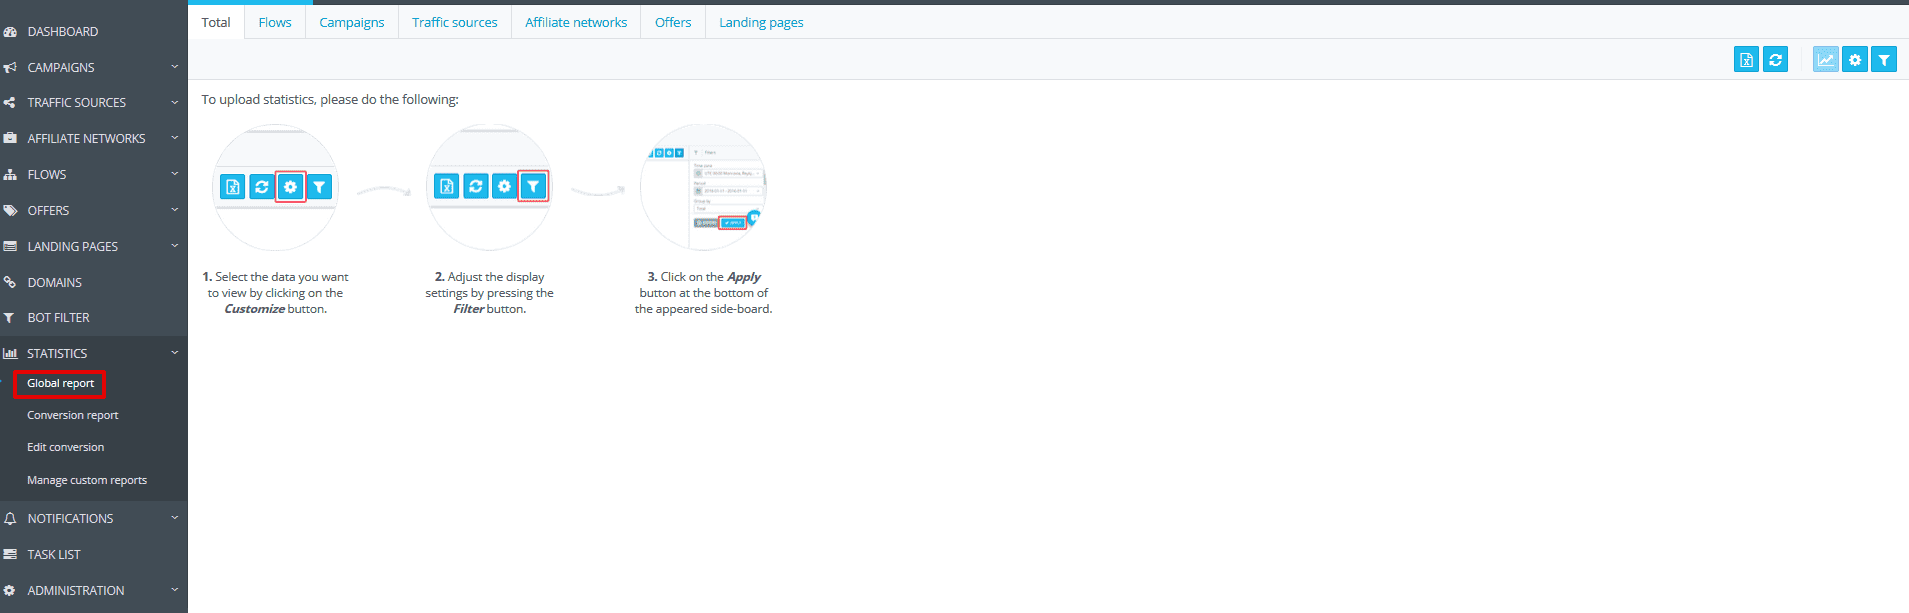
To upload statistics, please do the following:
- Select the data you want to view by clicking on the “Customize table” button.
- Adjust the display settings by pressing the “Filter” button.
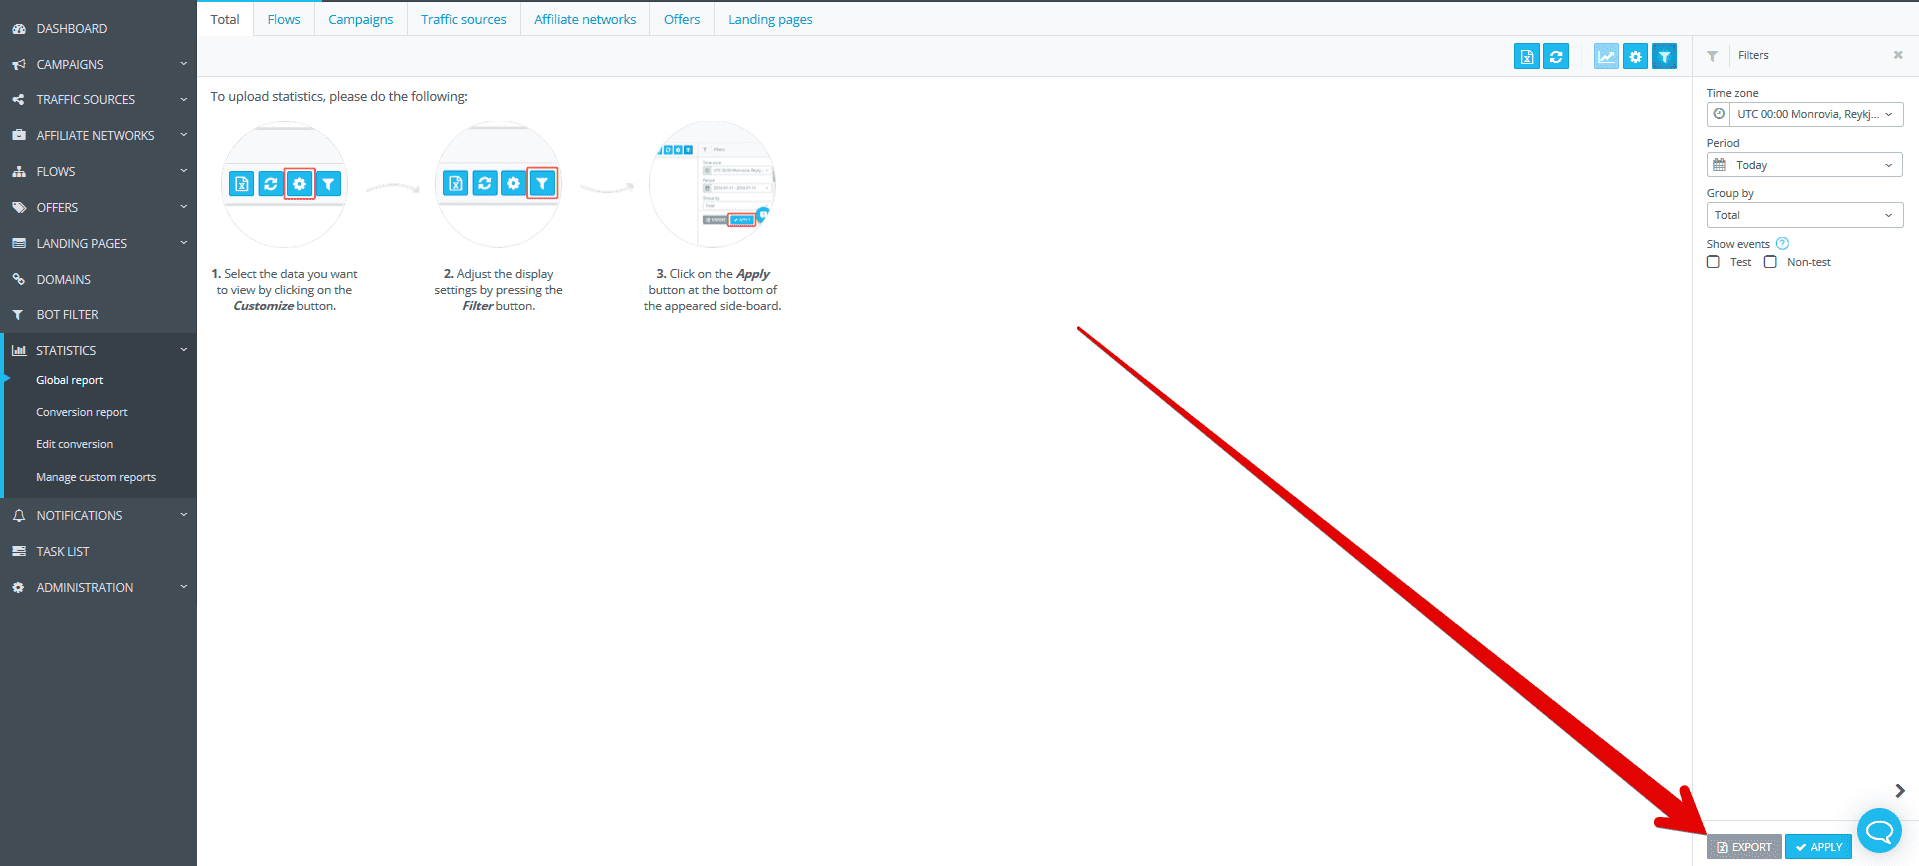
- Click on the “Apply” button at the bottom of the appeared side-board
You can do the following actions on this page:
“Export” allows you to export statistics in CSV that had been already displayed on the screen. AdsBridge also provides the functionality to export statistics without its prior output to the screen. In order to do so, select the necessary statistics settings and press the “Export” icon next to the “Apply” button in the side-board.
“Refresh” – refresh the stats on the page. Please bear in mind that by hitting “Refresh”, you apply the most recently saved statistics settings. In order to apply new filter settings, you will have to click the “Apply” button.
“Chart” – this button enables the graphical display of the stats. The chart encompasses such values as Impressions, Visits, Clicks, Conversions, Spend, Earnings, and Profit.

“Customize table”. This button pulls out the side-board containing the extensive statistics settings.
You can create 2 types of reports such as table and drill down.
Table Customized Report
In order to create table report just click on “Table” button on the right side panel. Here you can add any column you need to the report. All you have to do is to click upon the drop-down list and fill the checkbox opposite the requested column.

You will find the following sections in the table settings:
1) Currency. In order to select currency, which you would like the stats to be displayed on, pick the necessary item in the drop-down list. The available currencies are USD, EUR, GBP, RUB, UAH.
2) Your custom report. Here you can pick the pre-set report template that has been created earlier within the “Manage reports” subsection.
3) Data incorporates the campaign components. All the tabs contain such checkboxes as:
– Select all – this option allows you to select or unselect all the checkboxes within a section.
– Campaign group stands for the name of campaign group, e.g., Default (includes only those campaigns that make part of the “Default” campaign group).
– Campaign – the campaign name, e.g., (48529) Campaign1. The parentheses preceding the name contain the Campaign ID in the system.
– Flow group – the name of a flow group, e.g., One (includes only those flows that make part of the “One” flow group).
– Flow – contains the flow name, added in the campaign settings.
– Traffic source – contains the name of traffic source, created in the AdsBridge system and selected in the campaign settings at the first step of its creation. If you fill this checkbox and see the empty value within the statistics column, then such a campaign lacks the traffic source. For example, (5778) ExoClick. The parentheses preceding the name contain the Traffic source ID in the system.
– Rule – stands for the Rule name in a campaign to which the traffic was directed. For example, (679475) Default rule. The parentheses preceding the name contain the Rule ID in the system.
– Path – incorporates the path name in a campaign to which the traffic is directed. For example, (67912475) Default path. The parentheses preceding the name contain the Path ID in the system.
– Landing group – stands for the name of a landing group. For example, Group1 (includes only those landing pages that make part of the “Group1” landing group).
– Landing page – comprises its name. For example, (37204) Lander1. The parentheses preceding the name contain the LP ID in the system. Here’s one more example, Direct link, in instances when traffic is directed to a flow in a campaign with a direct offer link.
– Affiliate network – contains the name of an affiliate network, added in the settings of an offer, to which the traffic is directed. If you fill this checkbox and see the empty value within the statistics column, then the offer settings of such a campaign lack the affiliate network. For example, (22044) AdCombo. The parentheses preceding the name contain the Affiliate network ID in the system.
– Offer group – stands for the offer group name,e.g., Group1 (includes only those offer groups that make part of the “Group1” offer group).
– Offer – stockpiles the entirety of offer names. For example, (66051) Offer1. The parentheses preceding the name contain the Offer ID in the system.
4) Token
– Select all – this option allows you to select or unselect all the checkboxes within a section.
– Token 1 – Token 6 – when these checkboxes are activated, the Token 1 – Token 6 columns will display traffic source-related data that is transmitted through the campaign’s link. In other words, these are the values, which are passed through parameters pre-determined either in the campaign settings, or in the settings of a traffic source added to the campaign.
5) GEO
– Select all – this option allows you to select or unselect all the checkboxes within a section.
– Language stands for the language that is selected in a user’s browser (e.g., Chinese).
– Country – the full name of a country (e.g., France).
– Country ISO 2 – the two-letter country code (e.g., US).
– Country ISO 3 – the three-letter country code (e.g., USA).
– City (e.g., London).
– IP – determines the user’s IP (e.g., 5.255.250.79).
– Referrer domain represents a link of the domain from which a user made the transition through the campaign link of the tracker. Please note that some traffic sources may deliberately change a referral link. In addition to that, this field will be empty if a user makes a direct transition through the campaign link (for example, from a new browser window). (Example: www.domain.com).
6) User info
– Select all – this option allows you to select or unselect all the checkboxes within a section.
– Traffic type – encompasses various types of traffic (such as desktop, mobile, tablet, other). – Connection – either wireless or not, mobile, etc. (e.g., wifi, wired, mobile).
– OS – name of the operation system (e.g., Windows).
– OS version – version of the operation system (e.g., 7).
– Browser – the browser name (e.g., Chrome).
– Browser version – e.g., 59.
– ISP – name of the Internet Service Provider (e.g., A2 Ltd).
– Carrier – name of the phone carrier (e.g., Ice Wireless).
7) Device
– Select all – this option allows you to select or unselect all the checkboxes within a section.
– Type – the device type (e.g., iPhone).
– Manufacturer – the name of manufacturer (e.g., Apple).
– Model – the device version (e.g., 6S).
8) Statistics
– Select all – this option allows you to select or unselect all the checkboxes within a section.
– Impressions – the number of banner impressions (for example) on the side of a traffic source. The system will merely display this data provided that there’s a tracking pixel on the side of the traffic source. Please note that not all traffic sources offer such functionality. In addition to that, in case you utilize the pop-under traffic, each impression will be counted as a visit, not an impression, because in this case the campaign link is opened every time a pre-landing page or an offer shows up in the nearby browser tab.
– Visits – the number of transactions made through a campaign link.
– Clicks – the number of clicks upon the Call to action button on a pre-landing page. If there’s no pre-landing page in a campaign, the number of visits will be equal to number of clicks. Please note that in case you use a multi-offer pre-landing page in your campaigns, there’s a peculiarity in statistics display of the visits and clicks. For example, if you opt for viewing the stats on landing pages with the columns “Offer,” “Visits,” “Clicks” switched on, you will see one line with the overall number of visits and empty values in the columns “Clicks” and “Offer,” as well as other lines containing the extensive data on offers and clicks while the “Visits” column will remain empty. The reason behind such a peculiarity is the fact that if you use a pre-landing page with ability to head over to a specific offer, the system may track down the visit and click related to this very offer. As for a multi-offer pre-landing page, the system is unable to determine the exact offer of a user’s choice. Therefore, you will get the separate statistics on all visits, which were made through a campaign link and reached the pre-landing page, as well as separate statistics on all users’ clicks based on the selected offer.
– Conversions – the number of conversions that have come through S2S postback/tracking pixel or have been uploaded manually. Keep in mind that in case of using the conversion tracking statuses, the “Global report” subsection will show only approved conversions. All the conversions including their statuses are displayed in the “Conversion report”.
– Payout – represents the payout value of a certain conversion (the dynamic conversion-related payout value that has been transmitted through S2S tracker postback on the side of an affiliate network / a static value pre-set in the postback / a static value pre-set in the offer settings). Please note that the payout value contained within a postback is of higher priority than the value set in the offer settings.
9) Advanced
– Select all – this option allows you to select or unselect all the checkboxes within a section.
– Unique visits – the number of unique transitions made through a campaign link. The uniqueness is calculated on each campaign separately on a 24-hour basis with the help of cookie and the complete parameter set
– Bot visits – the number of bot transitions made through a campaign link. There are special rules in the bot filter according to which the tracker discerns the bot traffic.
– Unique clicks – the number of unique clicks upon the CTA button on a pre-landing page.
– Bot clicks – the number of bot clicks upon the CTA button on a pre-landing page.
– Unique conversions – the number of unique conversions.
– Bot conversions – the number of conversions made by users/bots, whose peculiarities coincide with the pre-set rules of the tracker’s bot filter.
10) Calculations
– Select all – this option allows you to select or unselect all the checkboxes within a section.
– CTR, % – the ratio of clicks upon the CTA button on a pre-landing page to visits (campaign link transitions). If you use a direct offer link, CTR will be equal 100%.
– CTR, 1/x – the ratio of visits (campaign link transitions) to clicks upon the CTA button on a pre-landing page. The formula for calculating this value is 1:Visits/Clicks.
– Visit2Conversion,% – the conversions to visits ratio.
– Visit2Conversion, 1/x – the conversions to visits ratio. The formula for calculating this value is 1:Visits/Leads.
– CR,% – the conversions to clicks ratio.
– CR, 1/x – the conversions to clicks ratio. The formula for calculating this value is 1:Clicks/Leads.
– EPV – Earnings per visit – helps to analyze the pre-landing pages.
– EPC – Earnings per click – helps to analyze the offers.
– Spend – the overall traffic costs.
– Earnings – the overall conversion payout.
– Profit – the difference between spend and earnings.
– ROI – Return on Investment – is calculated according to the formula: (Earnings – Spend) / Spend * 100%.
The checkboxes mentioned above are available on all tabs (Flows, Campaigns, Traffic sources, Affiliate networks, Offers, Landing pages), except for the “Total” tab.
As for the “Total” tab, it contains the stats on:
– Token,
– City,
– IP,
– Referrer domain,
– OS version,
– Browser version,
– ISP,
– Carrier,
– Device model.
Drill down Report
In order to create multi level report just click on “Tree” button on the right side menu. You will be able to choose one of three levels of breakdown. In order to choose it you will need to click on required option.
To separate stats on drop down menu levels you need to choose such data as:
1) Campaign elements. On every stats tab there are available such variants as:
– Campaign group stands for the name of campaign group, e.g., Default (includes only those campaigns that make part of the “Default” campaign group).
– Campaign – the campaign name, e.g., (48529) Campaign1. The parentheses preceding the name contain the Campaign ID in the system.
– Flow group – the name of a flow group, e.g., One (includes only those flows that make part of the “One” flow group).
– Flow – contains the flow name, added in the campaign settings.
– Traffic source is a name of the source of traffic created on AdsBridge platform and chosen on the first step of campaign creation. If you notice an empty column in the stats while choosing this option, this means that on this campaign group there wasn’t created any traffic source.
– Rule – stands for the Rule name in a campaign to which the traffic was directed. For example, (679475) Default rule. The parentheses preceding the name contain the Rule ID in the system.
– Path – incorporates the path name in a campaign to which the traffic is directed. For example, (67912475) Default path. The parentheses preceding the name contain the Path ID in the system.
– Landing group – stands for the name of a landing group. For example, Group1 (includes only those landing pages that make part of the “Group1” landing group).
– Landing page – comprises its name. For example, (37204) Lander1. The parentheses preceding the name contain the LP ID in the system. Here’s one more example, Direct link, in instances when traffic is directed to a flow in a campaign with a direct offer link.
– Affiliate network – contains the name of an affiliate network, added in the settings of an offer, to which the traffic is directed. If you fill this checkbox and see the empty value within the statistics column, then the offer settings of such a campaign lack the affiliate network. For example, (22044) AdCombo. The parentheses preceding the name contain the Affiliate network ID in the system.
– Offer group – stands for the offer group name,e.g., Group1 (includes only those offer groups that make part of the “Group1” offer group).
– Offer – stockpiles the entirety of offer names. For example, (66051) Offer1. The parentheses preceding the name contain the Offer ID in the system.
2) Token
– Token 1 – Token 6 – when you choose these parameters, then the data will be grouped by Token 1 –Token 6 and there will be displayed the information from the traffic source through the campaign link. So, there you will see the parameters which were set either on the campaign settings or traffic source settings.
Ability to group by Sub ID is available on every stat tabs (“Flows”, “Campaigns”, “Traffic Sources”, “Affiliate networks”, “Offers”, “Landing pages”) except tab “All”.
3) GEO
– Language stands for the language that is selected in a user’s browser (e.g., Chinese).
– Country – the full name of a country (e.g., France).
– Country ISO 2 – the two-letter country code (e.g., US).
– Country ISO 3 – the three-letter country code (e.g., USA).
– City (e.g., London).
– IP – determines the user’s IP (e.g., 5.255.250.79).
– Referrer domain represents a link of the domain from which a user made the transition through the campaign link of the tracker. Please note that some traffic sources may deliberately change a referral link. In addition to that, this field will be empty if a user makes a direct transition through the campaign link (for example, from a new browser window). (Example: www.domain.com).
Ability to group by City, IP, referrer domain is available on every stat tabs (“Flows”, “Campaigns”, “Traffic Sources”, “Affiliate networks”, “Offers”, “Landing pages”) except tab “All”.
4) User info
– Traffic type – encompasses various types of traffic (such as desktop, mobile, tablet, other). – Connection – either wireless or not, mobile, etc. (e.g., wifi, wired, mobile).
– OS – name of the operation system (e.g., Windows).
– OS version – version of the operation system (e.g., 7).
– Browser – the browser name (e.g., Chrome).
– Browser version – e.g., 59.
– ISP – name of the Internet Service Provider (e.g., A2 Ltd).
– Carrier – name of the phone carrier (e.g., Ice Wireless).
Ability to group by levels: OS version, browser version, ISP, mobile provider is available on every stat tabs (“Flows”, “Campaigns”, “Traffic Sources”, “Affiliate networks”, “Offers”, “Landing pages”) except tab “All”.
5) Device
– Type – the device type (e.g., iPhone).
– Manufacturer – the name of manufacturer (e.g., Apple).
– Model – the device version (e.g., 6S).
Note! The levels of grouping stats have to be chosen alternately. So, if you haven’t chosen the first level, the second one will be unavailable. In order to generate and display statistics, at least one level must be specified.
On the multilevel report settings you are able to find such sections as:
Currency. In order to select currency, which you would like the stats to be displayed on, pick the necessary item in the drop-down list. The available currencies are USD, EUR, GBP, RUB, UAH.
You are able to add any column to your report. Just click on the drop-down list and check the checkbox in front of the column you need.
Statistics
– Select all – this option allows you to select or unselect all the checkboxes within a section.
– Impressions – the number of banner impressions (for example) on the side of a traffic source. The system will merely display this data provided that there’s a tracking pixel on the side of the traffic source. Please note that not all traffic sources offer such functionality. In addition to that, in case you utilize the pop-under traffic, each impression will be counted as a visit, not an impression, because in this case the campaign link is opened every time a pre-landing page or an offer shows up in the nearby browser tab.
– Visits – the number of transactions made through a campaign link.
– Clicks – the number of clicks upon the Call to action button on a pre-landing page. If there’s no pre-landing page in a campaign, the number of visits will be equal to number of clicks. Please note that in case you use a multi-offer pre-landing page in your campaigns, there’s a peculiarity in statistics display of the visits and clicks. For example, if you opt for viewing the stats on landing pages with the columns “Offer,” “Visits,” “Clicks” switched on, you will see one line with the overall number of visits and empty values in the columns “Clicks” and “Offer,” as well as other lines containing the extensive data on offers and clicks while the “Visits” column will remain empty. The reason behind such a peculiarity is the fact that if you use a pre-landing page with ability to head over to a specific offer, the system may track down the visit and click related to this very offer. As for a multi-offer pre-landing page, the system is unable to determine the exact offer of a user’s choice. Therefore, you will get the separate statistics on all visits, which were made through a campaign link and reached the pre-landing page, as well as separate statistics on all users’ clicks based on the selected offer.
– Conversions – the number of conversions that have come through S2S postback/tracking pixel or have been uploaded manually. Keep in mind that in case of using the conversion tracking statuses, the “Global report” subsection will show only approved conversions. All the conversions including their statuses are displayed in the “Conversion report”.
– Payout – represents the payout value of a certain conversion (the dynamic conversion-related payout value that has been transmitted through S2S tracker postback on the side of an affiliate network / a static value pre-set in the postback / a static value pre-set in the offer settings). Please note that the payout value contained within a postback is of higher priority than the value set in the offer settings.
Advanced
– Select all – this option allows you to select or unselect all the checkboxes within a section.
– Unique visits – the number of unique transitions made through a campaign link. The uniqueness is calculated on each campaign separately on a 24-hour basis with the help of cookie and the complete parameter set
– Bot visits – the number of bot transitions made through a campaign link. There are special rules in the bot filter according to which the tracker discerns the bot traffic.
– Unique clicks – the number of unique clicks upon the CTA button on a pre-landing page.
– Bot clicks – the number of bot clicks upon the CTA button on a pre-landing page.
– Unique conversions – the number of unique conversions.
– Bot conversions – the number of conversions made by users/bots, whose peculiarities coincide with the pre-set rules of the tracker’s bot filter.
Calculations
– Select all – this option allows you to select or unselect all the checkboxes within a section.
– CTR, % – the ratio of clicks upon the CTA button on a pre-landing page to visits (campaign link transitions). If you use a direct offer link, CTR will be equal 100%.
– CTR, 1/x – the ratio of visits (campaign link transitions) to clicks upon the CTA button on a pre-landing page. The formula for calculating this value is 1:Visits/Clicks.
– Visit2Conversion,% – the conversions to visits ratio.
– Visit2Conversion, 1/x – the conversions to visits ratio. The formula for calculating this value is 1:Visits/Leads.
– CR,% – the conversions to clicks ratio.
– CR, 1/x – the conversions to clicks ratio. The formula for calculating this value is 1:Clicks/Leads.
– EPV – Earnings per visit – helps to analyze the pre-landing pages.
– EPC – Earnings per click – helps to analyze the offers.
– Spend – the overall traffic costs.
– Earnings – the overall conversion payout.
– Profit – the difference between spend and earnings.
– ROI – Return on Investment – is calculated according to the formula: (Earnings – Spend) / Spend * 100%.
What does it mean when the multilevel report displays in stages? Let’s follow the example below:
Level 1 – campaigns
Level 2 – rule
Level 3 – offers
Every selected checkbox means values displayed in columns (similar to a table report).
When stats has just been generated, the the lanes you see are created campaigns (chosen level 1). When you click on campaign there will be appeared the list of added rules (level 2). As the result, the campaign appears to be as a list of rules, while clicking on which the report breaks on the rules. But this is not all. When you click on rule, it opens the list of available offers (level 3), which were added on specific rule.
For example, when you click on Rule (4323), then the list of 7 offers appeared. Every offer has its own indicators – visits, clicks, conversions, ctr, etc. So, the Rule (4323) raw will have summary of offers’ indicators.
“Filters” icon – this button activates the side-board with all the necessary statistics parameters. Here it’s possible to select the necessary time zone, period, group type, object or a group thereof to be displayed in the statistics, as well as type of the events – test/non-test. The process of setting up filters is similar for both table and multi level reports.

The “Total” tab incorporates:
– Time zone;
– Period;
– Group by: total/year/month/week/day/hour;
– Show events: test/non-test.
The “Flows” tab incorporates:
– Time zone;
– Period;
– Group by: total/year/month/week/day/hour;
– Flow – you can view statistics on any given flow;
– Rule – you can view statistics on any given rule within a flow;
– Path – you can view statistics on any given path within a flow;
– Show events: test/non-test.
The “Campaigns” tab incorporates:
– Time zone;
– Period;
– Group by: total/year/month/week/day/hour;
– Group – you can view statistics on the campaigns, added to a specific group;
– Campaign – you can view statistics on any given campaign;
– Path – you can view statistics on any given path within a campaign;
– Show events: test/non-test.
The “Traffic sources” tab incorporates:
– Time zone;
– Period;
– Group by: total/year/month/week/day/hour;
– Traffic source – you can view statistics on any given traffic source. Please note that in order to view this statistical data, you need to create a traffic source and add it to your campaigns. Otherwise, the statistics on such a campaign will not be taken into account when compiling a report on a certain traffic source;
– Show events: test/non-test.
The “Affiliate networks” tab incorporates:
– Time zone;
– Period;
– Group by: total/year/month/week/day/hour;
– Affiliate network – you can view statistics on any given affiliate network. Please note that in order to view this statistical data, you need to create an affiliate network and select it in the offer settings. Otherwise, the statistics on such an offer will not be taken into account when compiling a report on a certain affiliate network;
– Show events: test/non-test.
The “Offers” tab incorporates:
– Time zone;
– Period;
– Group by: total/year/month/week/day/hour;
– Group – you can view statistics on the offers, added to a specific group;
– Offer – you can view statistics on any given offer;
– Show events: test/non-test.
The “Landing pages” tab incorporates:
– Time zone;
– Period;
– Group by: total/year/month/week/day/hour;
– Group – you can view statistics on the landing pages, added to a specific group;
– Landing page – you can view statistics on any given landing page;
– Show events: test/non-test.
Keep in mind that when selecting the period, you may opt for such default parameters as Today, Yesterday, This week, Last 7 days, Las week, This month, Last 30 days, Last month. Please note that if you select such parameters as Last 7 days and Last 30 days, the system will show you the stats without taking into account the today’s date. The Last week and Last month parameters imply displaying the stats for the last complete week/month. As for This week and This month parameters, they are meant to display the statistics for the entire period from the beginning of the week/month up to the present day.
Each tab within the “Statistics” section contains the “Total” line, where you will see the total value by all key figures.
When working with the “Statistics” section, you can make use of the following tools:
1) Filter by values in some columns. To do this, you need to click on the “Filter” icon next to the column name, select the value and click the “Apply” button.
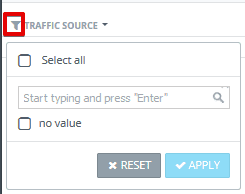
If the column is overfilled with values, the system will not update the list automatically. However, here’s how you will be able to find the necessary value by hand: input the value, and then hit “Enter”. After that you will be shown a checkbox with the value, fill it and press the “Apply” button. Such columns as Impressions, Visits, Clicks, Conversions, Payouts, Unique visits, Bot-visits, Unique Clicks, Bot-clicks, Unique Conversions, Bot-Conversions, CTR,%, Visit2Conversion,%, CR,%, EPV, EPC, Spend, Earnings, Profit, and ROI imply filtering by the following conditions: equal, greater than, less than, greater than or equal, less than or equal, not equal.

Please note that you can filter the results by several columns at once. In order to cancel the filtering, click on the “Filter” icon and press the “Reset” button.
2) When you click on the arrow icon on the right of the column name, you’re able to sort either by alphabet (A-Z, Z-A) or by quantity (from the greatest to the least and vice versa).