On this page, you can see all the created landing pages. Here, you can also move to the page for creating a landing by clicking on the “Create Landing Page” button and see the landings that you added to the archive by clicking on the “Archive” button.
Landings are distributed according to the groups specified in the settings. You can hide the group (folder) by clicking on the folder icon.
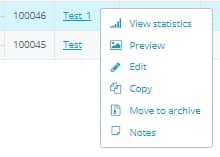
In the upper right corner, you can see the “Actions” panel.
![]()
“View statistics” icon becomes active when you select a specific landing on the page. By clicking on this icon, you will be redirected to the “Statistics” section by this LP where you will see more information.

“Preview” icon becomes active when you select a specific landing on the page. By clicking on this icon, the landing page preview will open in the next window.
Please note that in the preview mode, the CTA-buttons of the landing page lead to the offer’s example. To check the redirects, you need to go to the campaign link to which this LP is added.
“Edit” icon becomes active when you select a specific landing page. After clicking on this button, you will see a pop-up with the basic settings that you can edit. Landing pages created in the visual or HTML editor on AdsBridge can be changes in the editor. To do this, click “Go to landing editor” button. After making changes to the pop-up, click “Save & Close”. To close the pop-up, click the cross symbol in the upper right corner.
“Copy” icon becomes active when you select a specific landing page. It allows you to copy any LP you want with its settings. The name of a newly-copied LP will look like the initial landing page name+_copy1.
“Move to archive” icon becomes active when you select a specific landing page. Currently, the AdsBridge platform does not provide the delete option; therefore, if you wish to stop using a landing page in your campaigns, you can move it to “Archive”. Archived LPs may be re-activated if necessary. In the “Archive”, you can search landing pages by ID and name. As for the information available on the archived LPs, you can view their ID, Name, Type, Archiving date, Actions (icon for changing over to “Statistics” section on a specific landing page).
“Notes” icon becomes active when you select a specific landing page. Here, if necessary, you can add any note on the LP. For this, enter text in the bottom field. The following options are available for text formatting: cancel, repeat, bold, italic, underline, strikethrough. Once you entered the text, press “Apply”, and it will be displayed on the top field. The added note will be shown as an icon near the LP name. The information available on the note is the name of a manager who created it (useful when there is a multi-user access to the account) and date. Moreover, you can edit or delete the note.

Please note that when you copy the landing page, the note is not copied.
“Export” icon exports the uploaded statistics in CSV.
“Refresh” icon refreshes the statistics on the screen.
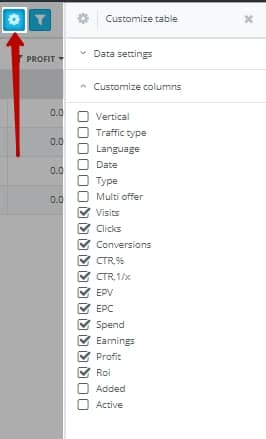
“Customize table” icon opens the side menu, in which you can edit the statistics display in the “Manage landing pages” section. At the moment, you can adjust the following columns: Vertical, Traffic type, Language, Date (creation date), Type, Multi offer (the number of offers set for the LPs), Visits, Clicks, Conversions, CTR,%,CTR,1/x, EPV, EPC, Spend, Earnings, Profit, Roi, Added (number of campaigns where this LP is added), Active (number of campaigns where this LP is active).
In order to view detailed information about which campaigns have been added and which campaigns are active, you need to click on the number of campaigns listed in the “Added” or “Active” column. When the pop-up opens, you can view the campaign ID, Campaign name, Number of times (how many times the LP was added to the campaign), Action (the switch to campaign statistics). Also, if to click on the arrow near the campaign ID, you can see the rule, where this LP was added within a certain campaign (rule ID, name, and the ability to move to the campaign statistics by this rule). By clicking on the campaign name or the rule, you can move to the campaign’s or rule’s settings.
Also, in the table settings, you can select the currency in which EPV, EPC, spend, earnings, profit will be displayed. The payout column will display a static value with the currency in the column itself.
“Filters” icon opens the side menu in which you can set the statistics’ display in the “Manage landing pages” section.
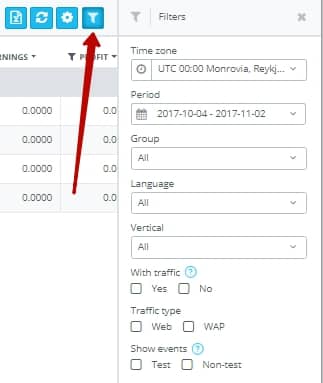
This menu contains the following options:
“Time zone” – you can select the time zone in which you’d like to view the statistics.
“Period” – set the period within which you’d like to view statistics in the “Manage landing pages” section. By default, there are such options: Today, Yesterday, This week, Last 7 days, Last week, This month, Last 30 days, Last month.
Please note that when choosing such options as “Last 7 days” and “Last 30 days”, the displayed statistics won’t include today. “Last week” and “Last month” display statistics for the last week/month. “This week” and “This month” displays statistics for the period from the beginning of the week/month to the present day.
“Group” – in the drop-down for this option, you can choose the group of flows for which you’d like to view the statistics.
“Language” – in the in the drop-down list you can select landing pages for a specific language group to view the statistics.
“Vertical” – in the drop-down list of this option, you can select the vertical of the landing page to view the statistics.
“With traffic” – if you choose “Yes”, the table will display all landing pages that have at least one click for the specified period. If you tick “No”, then the table will display all landing page that didn’t receive any clicks for the specified period. You can view LP statistics with or without traffic at the same time by ticking both boxes.
“Traffic type” – here you can select the LP type (web or WAP) for statistics display. If to tick both boxes, you can view statistics on all landing pages.
“View events” – by selecting “Test”, the table will display only the test events (events, which were made by the test campaign link), “Non-test” – only non-test events. You can view statistics by test and non-test events at the same time if you tick both boxes.
In the “Total” line of this section, you will see the total value for some parameters.
Please note that you can filter data by specific values in some columns. For this, you need to press the “Filter” icon near the column name, select the value and press “Apply”.
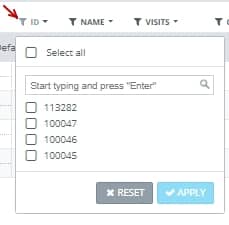
If there are too many values in the column, the system won’t upload the list automatically; however, you still can find the needed value by entering its name and pressing “Enter”. After that, the checkbox with this value will be displayed, tick it and click on the “Apply” button.
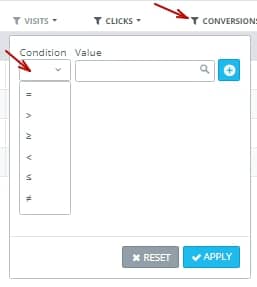
In the columns Payout, Visits, Clicks, Conversions, CTR,%, EPV, EPC, Spend, Earnings, Profit, ROI, you can filter data using the following conditions: equal, more, less, more or equal, less or equal, not equal.
By clicking on the arrow icon near the column name, you can sort it alphabetically (A-Z, Z-A) or by quantity (from larger to smaller and vice versa).
Also, if to right-click on the line with a specific landing page, you will see the menu with a list of actions: View statistics, Preview, Edit, Copy, Move to archive, Notes.
A double-click on a line with a specific landing page opens the additional browser window with statistics on this LP.